

Every marketer needs data.
Not that data. Marketing data. Data to help inform your strategy and better execute your next campaign.
That’s especially true for social media marketers. The social space can feel like a complete lottery – one post takes off, while the next one sputters and stalls.
And while it’s never a sure thing, you improve your chances of success when you make decisions fuelled by information.
So to help you out, we sifted through more than 700 million tweets to find engagement trends and takeaways, and hopefully give you that data you desperately need.
The full report is free to download here.
And if you’re not ready for that level of depth, here are 13 highlights to whet your appetite.
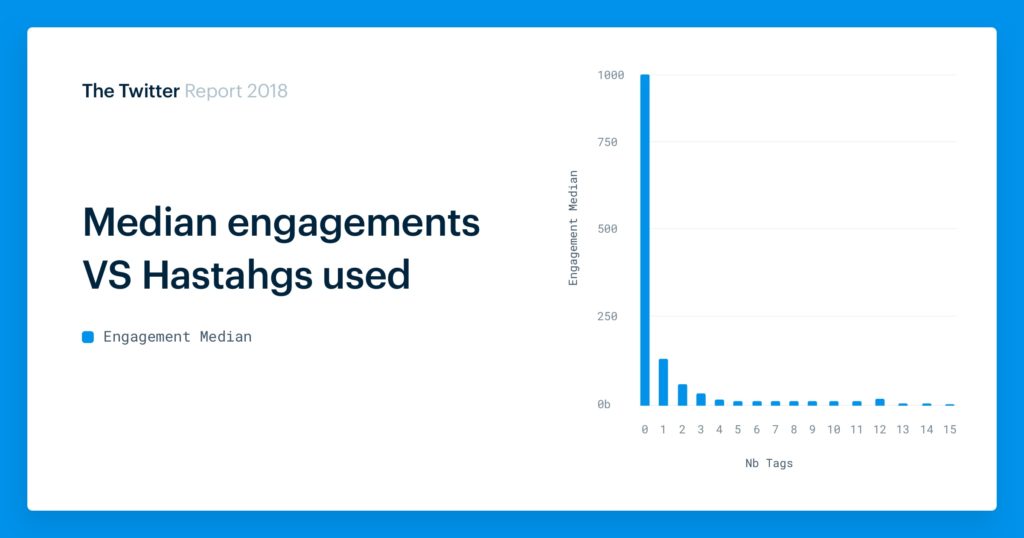
1. Tweets with no hashtags, tagged handles, or emojis have the best engagement rates
Yep, it’s true. The average engagement rate for tweets overall is actually a whopping XYZ. (There’s a “but” coming shortly).
And here what it looks like when you add a hashtag…
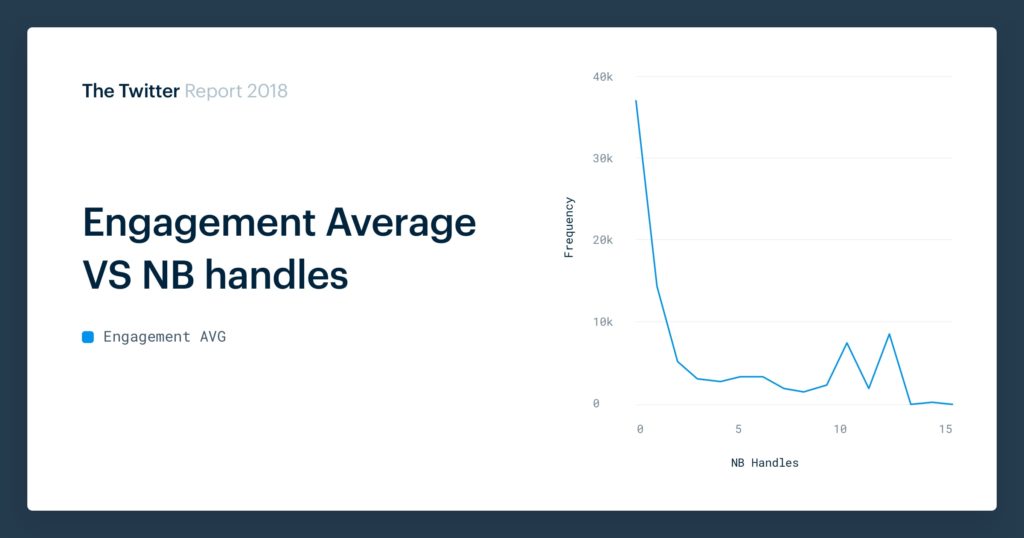
…or a handle (to tag another user)…
…or an emoji…
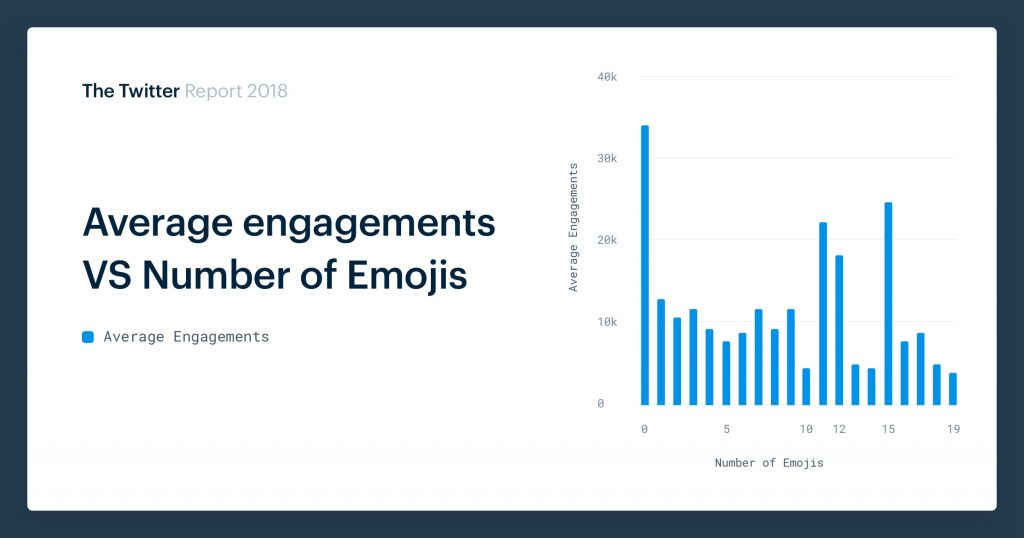
We’re going to look closer at all three of these features in a moment. But if you thought that throwing a hashtag or emoji into your next tweet would drive up engagements, you’re sadly mistaken.
The Twitter Engagement Calculator allows you to measure the engagement rate of any Twitter account based on average likes and tweets.
2. Overall, hashtags don’t increase Twitter engagement
You saw that chart above. Hashtags don’t seem to cause users to engage with your content, and in fact the opposite may be true.
That seems sort of astonishing. But we actually found exactly the same thing for Instagram. Despite what we’d probably all imagine, using these social media features don’t really help in the engagement game.
What matters most is content quality.
Some of this is reflected in the way the platform works now. At first, hashtags were used to bundle tweets together, so users could find posts on a similar topic. And of course they still do this.
But we don’t actually need hashtags to find tweets anymore.
Have you noticed how the Trends on the left of your Twitter feed don’t rely on hashtags much?
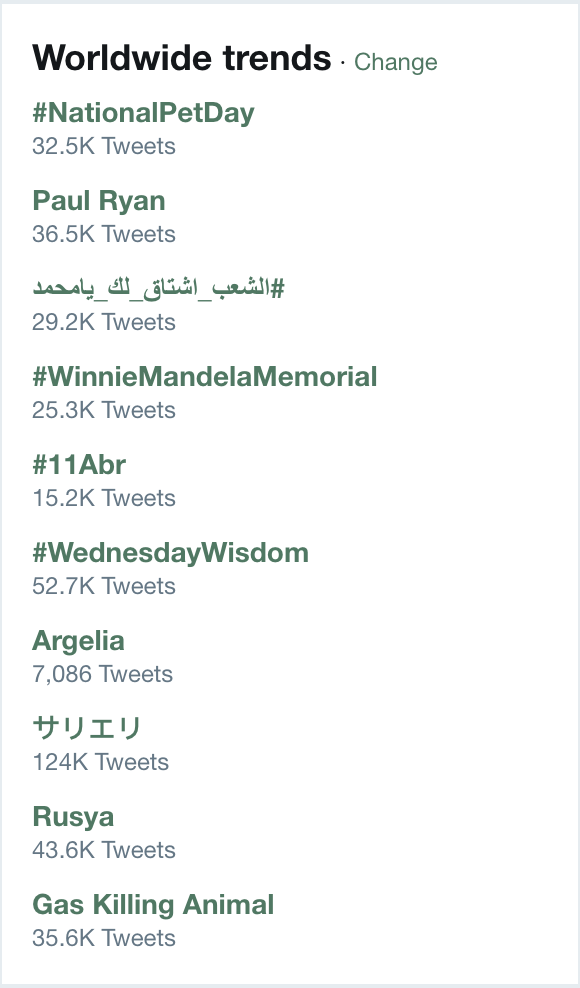
And you can easily search for terms just like you would with any search engine, hashtag or not. So we don’t really need them.
But where marketers can still use hashtags to great effect is in tracking campaigns. If you can encourage followers and fans to use your branded hashtags, it becomes much easier to track your campaigns on social media.
So while hashtags aren’t really going to help you get your content shared, you can still build strong campaigns around unique hashtags and be confident you can monitor how well that campaign performs.
3. The most popular hashtags are…
- #giveaway
- #quote
- #win
- #marketing
- #travel
As in, those 5 hashtags were the most used on the platform from 2016 until now.
And just for fun, here were the top hashtags in our recent Instagram Report:
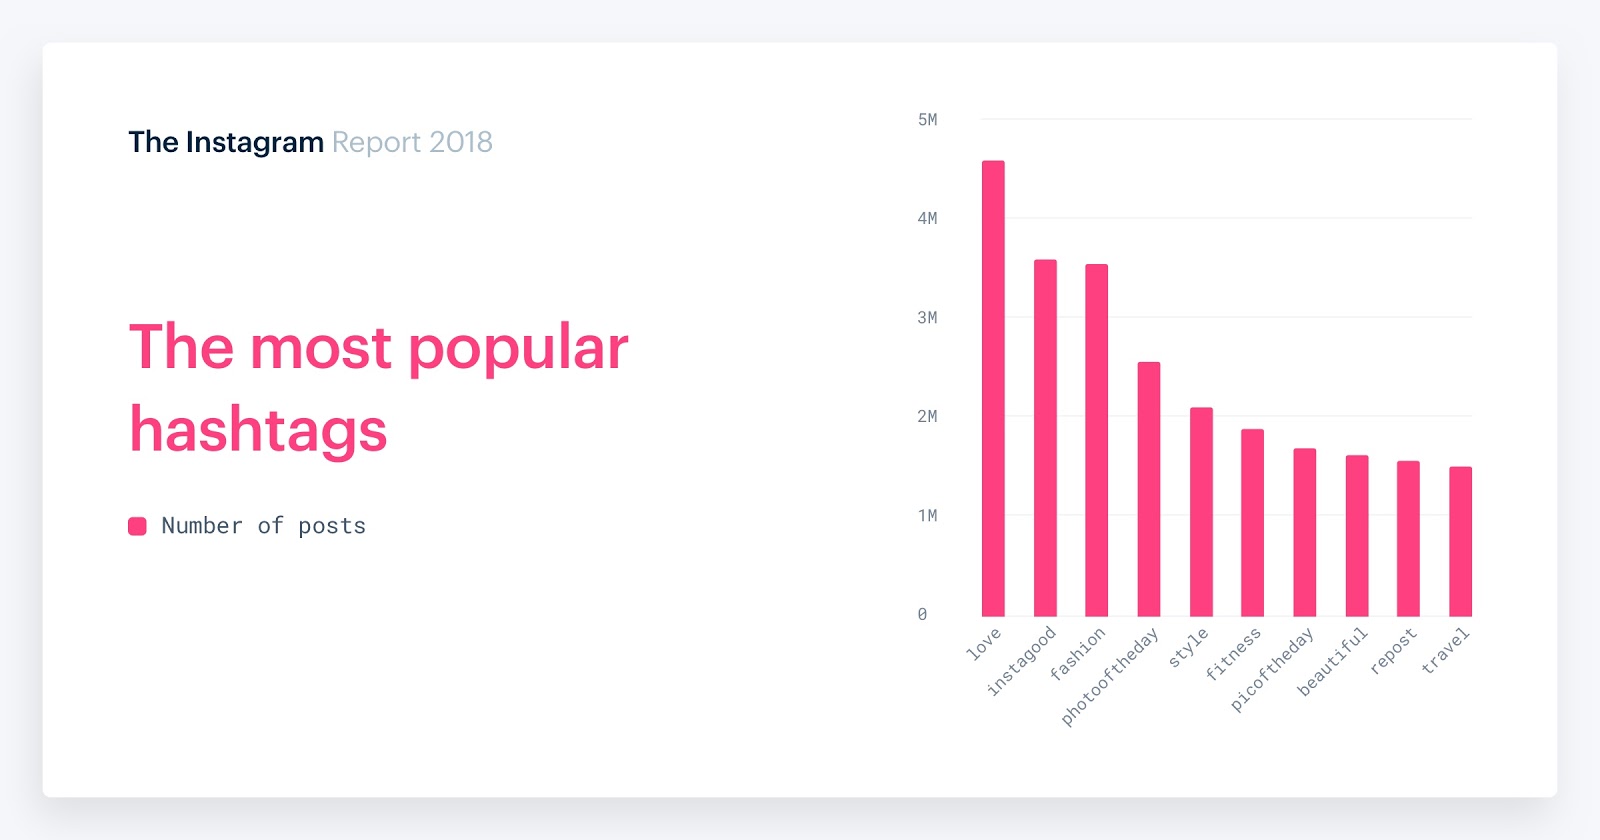
You see immediately the difference in the kinds of people that use these platforms, and the kinds of content they share.
Twitter seems to be dominated by marketers and brands trying to promote their wares. And the cruel twist is that the chances of people actually looking through thousands of “#marketing” tweets are pretty slim.
Would you scroll through those?
There’s frankly not much point in adding “#marketing” or “#quote” to your posts. There are too many posts using these, and they’re not exactly inspiring.
You’re far better off creating unique tags for a campaign, or joining specific conversations around events. For instance, “#AppleEvent,” “ElectionDay,” and “#GalaxyS8” were all ranked inside the top 50 for engagement in our study.
For a few more generic options, you could try “#SundayMorning” (44th), “#Spring,” and (127th), and “#Inspiration” (175th) were all considerably above average.
4. But the most engaging hashtags are…
- #LOVE_YOURSELF
- #JIMIN
- #BTS
- #DNA
- #TheLastJedi
This deserves a whole blog post just to explain it. In the course of this study, we discovered a wave of, frankly, insane K-Pop fans. Insane in the best possible way, of course.
Those top four hashtags all relate to one South Korean boy band: BTS.
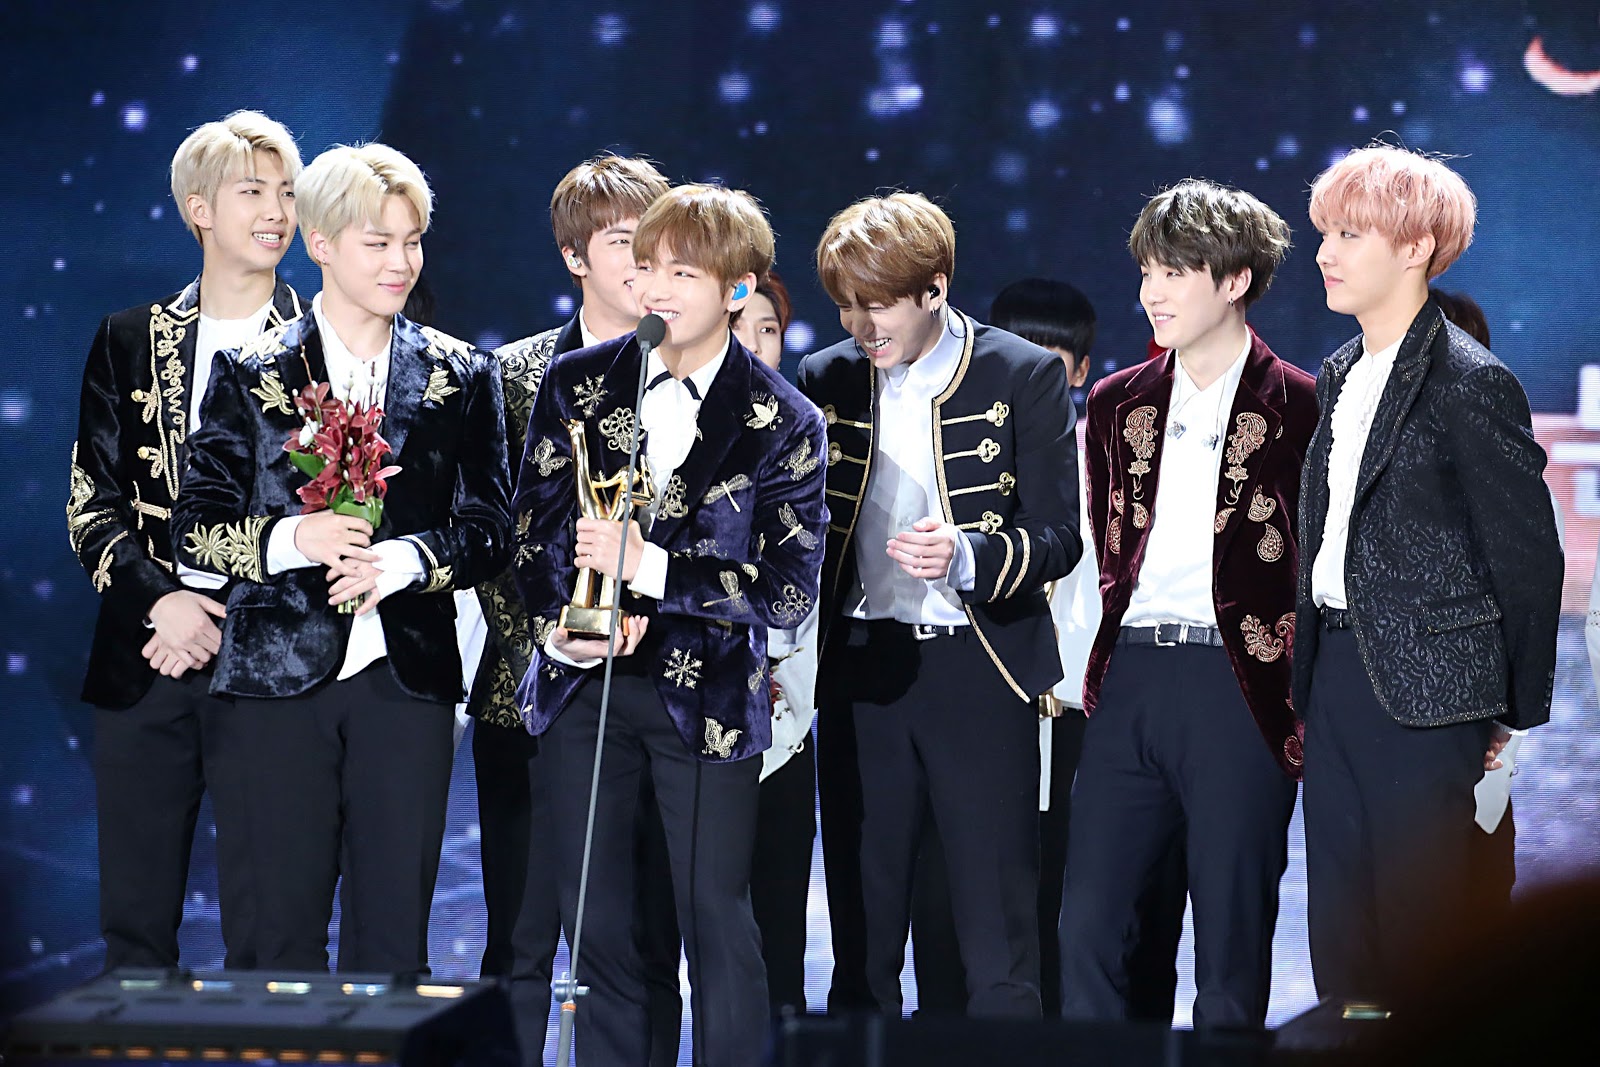
These smiling fellows routinely win awards for their social media performance, and the audience they’ve built on Twitter specifically.
K-pop made significant strides in the west in 2017 – especially in the US. And BTS made the biggest strides of all.
We won’t go into it in full here, but the main reason for the group’s Twitter success is its loyal “ARMY” (as fans have dubbed themselves). They have a fierce passion for making BTS-related topics trend, and whenever one of the band members posts something new, it leads to a sharing frenzy.
Even if we can’t all replicate this level of obsession for our own brands, it’s worth keeping an eye on how attentive and open the BTS boys have been. Their social media savvy have taken them from underdogs (including in Korea) to a mainstream, worldwide success story.
5. The most popular Twitter emojis are…
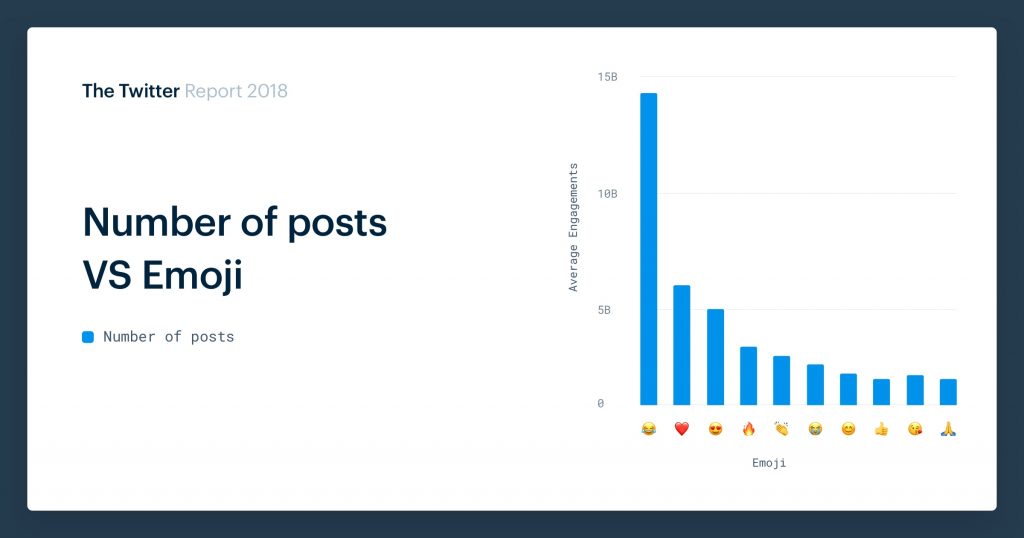
As we saw with hashtags above, this isn’t the most riveting list. You could probably have guessed most of these Twitter emojis in some order.
And besides, knowing the most popular emojis isn’t necessarily going to help you improve your Twitter marketing. (Although it might tell you which emojis are now played out).
But the next paragraph is a lot more interesting:
6. The most engaging Twitter emojis are…
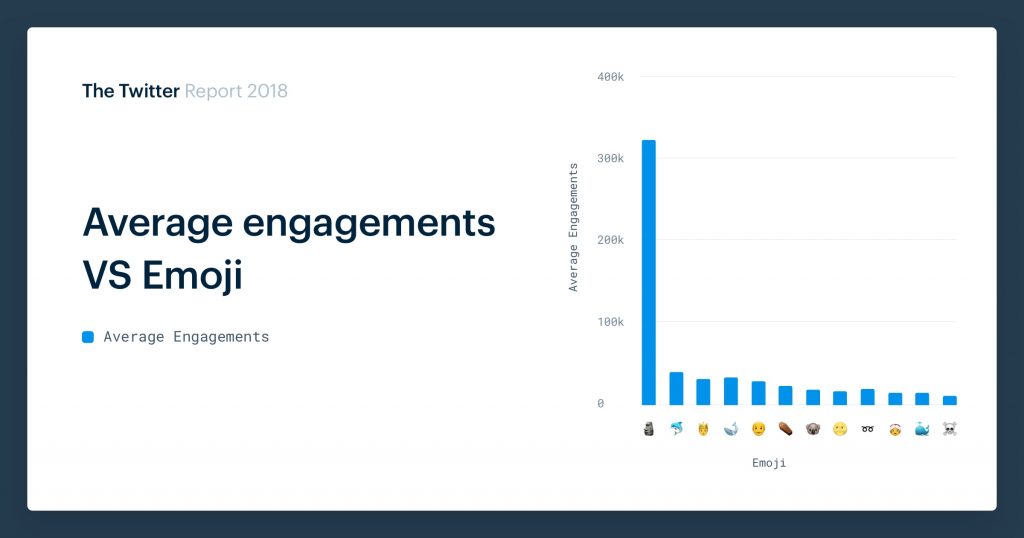
The top result can be explained entirely by one tweet:
That was the most retweeted post of 2016, and remains the 6th most retweeted post of all time. In August of that year, Spanish YouTuber ElrubiusOMG appealed to his sizable audience to help his tweet go down in history.
He offered prizes to fans who retweeted, although it’s unclear how many were actually given out.
This really demonstrates the effect that one tweet can have on average engagement rates. Not counting retweets, that emoji (known as “Moai” or “Easter Island”) was only used 10,773 times in our study.
To compare, the runner up (“dolphin”) was used 78,903 times. And while the average number of retweets for Moai was 6.5x higher than dolphin, the median number of retweets for dolphin is 74x higher!
As a quick high school math refresher, if you line up every individual data point, the median is the number in the middle: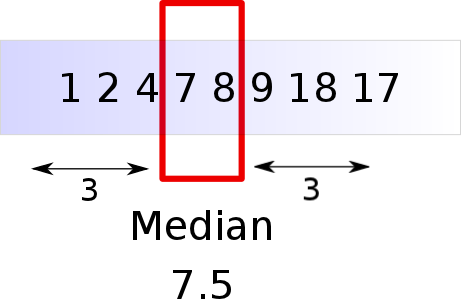
This is useful because it makes the posts at the extremes less impactful. So whereas one tweet containing Moai threw these results out of whack, the median tells us that dolphin may actually be a more engaging emoji for users who don’t have millions of YouTube followers and prizes to hand out.
Which brings us to…
7. Emojis with the highest median engagement…
After that quick statistics lesson, maybe we should actually care most about the emojis with the highest median retweets.
In that case, the list looks like this:
| ➝ |
| 🗡 |
| ➞ |
| 🦇 |
| ┻ |
For some reason, two arrow emojis appear in our top 5. The top has a median rate of more than 10,000 retweets, while the bold arrow has a little under half that.
Unfortunately, we don’t have a clear case for why these emojis elicit so many retweets. Unlike the previous section, there’s no one phenomenally popular tweet to rely on.
So it’s anybody’s guess why the sword and the bat join those two arrows on this list, or what that 5th emoji even serves to represent.
8. On average, bios with 91 characters have the most followers
Every brand is looking for an edge. Something that’ll make their account shine a little brighter on the social network. And while it’s tempting to tell them to “create better content,” that’s easier said than done.
But one thing brands can control is there profile. That little space where they get to talk about themselves and explain why followers should care.
And we did find a link between the length of your Twitter bio and the number of followers you have. So there is room for optimization – every digital marketer’s favorite pass-time.
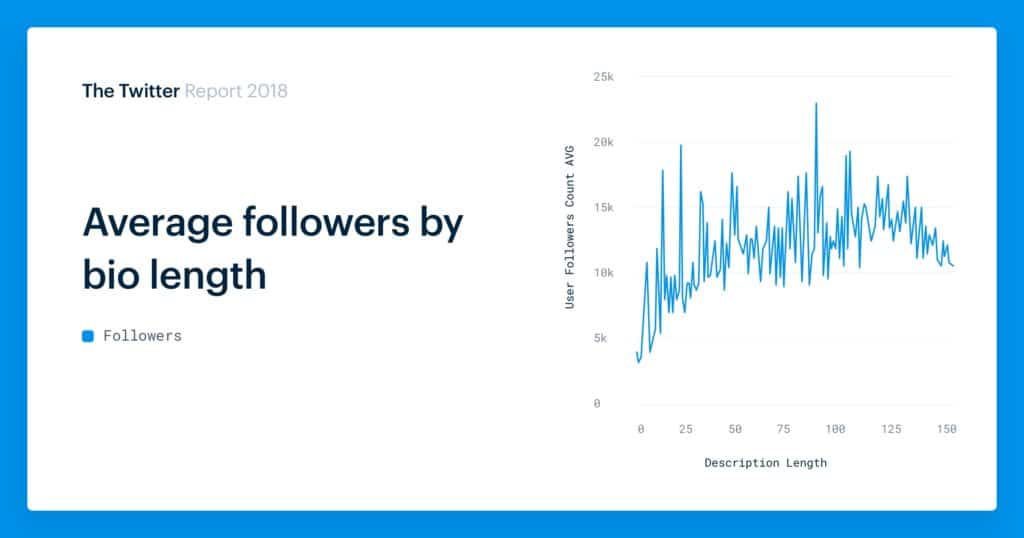
That graph shows the distribution of bio lengths for more than 3.5 million Twitter profiles. And one number shines above the rest: 91.
For some reason, profiles containing exactly 91 characters have the most followers. So we should all rush off and craft bios with 91 characters, right?
Not exactly. Since that’s the average, it’s likely heavily weighted by one or two massive Twitter users.
Which is why we also have the median…
9. By median, the longer your bio, the more followers you have
Looking at the median number of followers (vs bio length), we see something different:
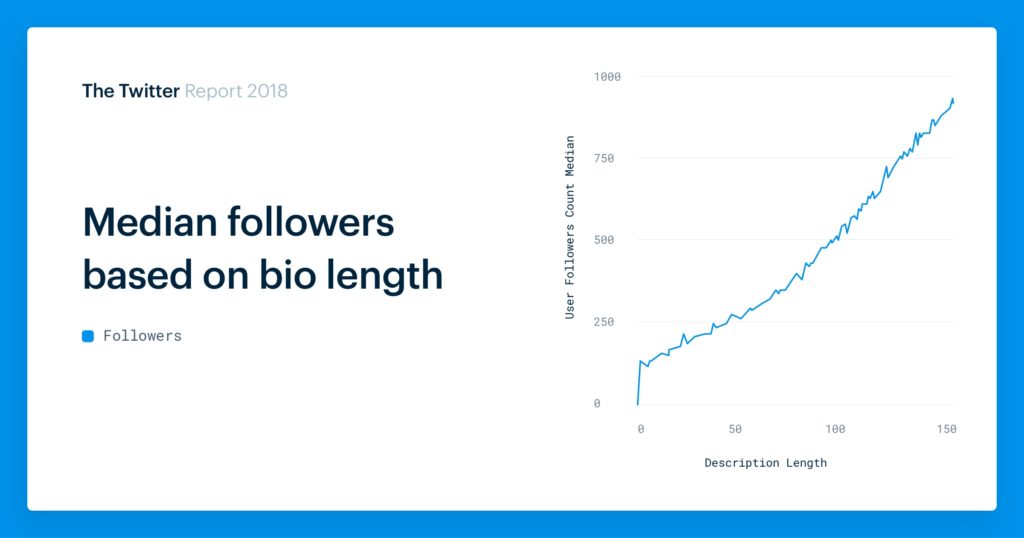
According to these numbers, the more characters in your bio, the more followers you’re likely to have. And because we’re using the median again – not the average – this may be the approach you prefer to take.
At present, Twitter lets you use up to 160 characters in your bio. So it may make sense for marketers and brands to aim for that maximum number.
Remember, there are tools out there that help people find followers based on the terms in their bio. So the more words in your bio, the more likely you’ll be found by those tools.
It’s probably no coincidence that 160 characters was also the most common bio length in our study. People tend to aim for the maximum.
And why not, since these longer bios seem to correlate with more followers.
So if you’re looking for some help crafting the perfect bio, check out Twitter Bio Generator. It can help you create a compelling bio that is sure to attract more followers.
10. Bios containing hashtags do not have more followers
One trick that doesn’t help you add followers is to use hashtags in your bio. This is a move many users make in the hopes that it’ll make their profile easier to find. People search for hashtags, and if they land on your profile in the process, that’s a big win!
That makes sense. But we found no correlation between the number of hashtags in a bio and the number of followers for that account.
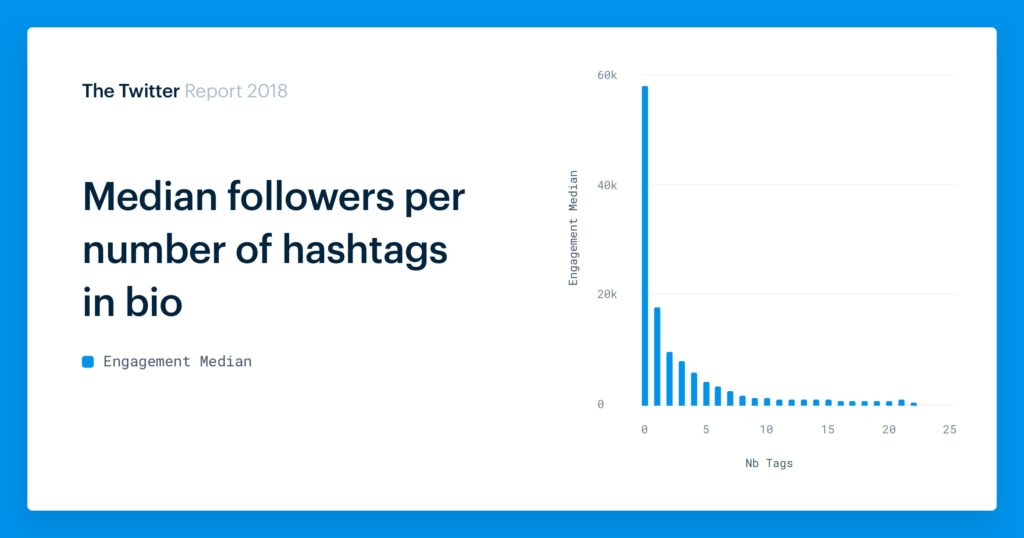
The takeaway here is pretty simple: you’re free to include hashtags in your bios if you’d like, but do so because they’re funny or make your bio more interesting. Don’t expect it to lead to more followers.
11. Verified accounts have higher average engagement rates
I can hear you screaming already: “of course they do!” Naturally, we’d expect verified accounts to perform well engagement-wise.
And they do. So you’re right!
But it’s not just because they’re bigger accounts from well-known brands and individuals. They do generally belong to known people or businesses (this is what’s being “verified”), but they’re not always huge accounts.
And to make this a fair test, we used a control group. We didn’t want mega-celebrities – verified accounts, of course – to drive engagement rates way up.
So we looked exclusively at engagement rates for accounts between 10,000 – 100,000 followers, both verified and not.
We had a pool of 29,381,768 million Twitter accounts, of which 17% were verified. And even in that control group, the verified accounts had significantly higher engagement rates:
Average engagements for verified accounts: 865.99
Average engagements for unverified accounts: 676.98
Not exactly a surprise, but interesting nonetheless.
12. Periscope videos have lower engagement rates than average tweets
Twitter bought video streaming service Periscope in January 2015. This lets the network offer free live streaming to all Twitter users, natively within the platform.
And marketers got excited. It’s hard to blame anyone really – whenever something shiny and new comes out, we marketers try to find the best ways to take advantage.
It made sense that, if you’re interacting with people in real time – live – the engagement rates must be through the roof! Well, not exactly.
Average engagements per Periscope videos: 781.17
Average engagements per tweet (overall): 1695.62
Of course, this is another average. And my guess – just a hunch – is that there are plenty of small-scale Twitter accounts using Periscope for fun, testing it out, and not really putting out top-notch content. And this brings the average down.
Which is fine and all, but it doesn’t seem to have captured the imagination of the top tweeters out there. And three years later, we don’t hear as much about Periscope as we used to.
There are definitely some Periscope success stories. And it’s obviously better to have these extra features in Twitter, than not have them.
It’s just probably not the panacea that many marketers thought it was. And the same may well go for Facebook Live, YouTube’s offering, and all the rest.
13. Black Panther is already the most tweeted-about movie of all time
This one comes from Twitter itself – not our study – but it’s a fun one so we thought we’d share:
Despite only being released at the end of January, 2018, the hottest film of this year is already the hottest film ever on Twitter.
Go out and dominate!
Hopefully you found a few nuggets in amount those 13 highlights that’ll help you build a more solid social strategy. If not, there’s plenty more in the full Twitter Report here.
Need to create a tweet quickly? Try our AI Tweet Generator for automated content that matches the style of your Twitter account.


