As a marketer or business owner, would you like to acquire free backlinks, increase user time spent on a page, and get brand exposure on social media through social media sharing? If so, infographics are a great tool for you and your business.
Infographics are not a new concept and a lot of brands similar to yours are already using them in their marketing strategy. So how can you stand out and create more engaging visual content than competitive websites?
We are here to lead you through the process! Let’s first see what makes a great infographic that gets shared online.
Table of Contents:
- What makes a great infographic?
- 1. Use the right visual type
- 2. Choose the right template
- 3. Think about your target audience
- 4. Prepare a good headline
- 5. Double-check your statistics
- 6. Keep in mind best design practices
- 7. Optimize your infographics SEO
- Summary
What makes a great infographic?
How many times have you read something online and had to go through it again and again to fetch all the important details? Some concepts can be quite difficult to get a grasp on — imagine reading about the process of galvanization for the first time.
Hopefully, there are a lot of tools that make it easier to visualize complex information and intricate topics.
That’s exactly what a good infographic does. For readers, it helps interpret information and for creators, conveys their ideas in an easy and approachable way.
There are many different infographic layouts and styles. There are bar and pie charts or illustrations and icons that are widely used in infographic designs. They can contain one or multiple columns — both vertical and horizontal or combined. This means you can create one infographic in a million different ways.
However, to create a successful one that conveys your idea effectively, you have to choose the most appropriate structure that makes it easy to explain the key concept.
Even though infographics are often perceived as a visual form of content, a great infographic is the one that conveys the key message and gets a reader to believe in what you have to say. Graphics, charts, and icons are only the means to make that message stand out and tell a story.
So what are the steps to creating a convincing story with a great infographic?
7 Best Practices for Creating Great Infographics
You don’t have to be a professional graphic designer to create engaging infographics. There are so many free graphic design tools that you can use with zero-to-no skills in graphic design. You just have to account for some key principles that make your infographic more interesting for users. Here is the good news — you can make progress fast. So let’s see how to make a successful infographic.
1. Use the right visual type
You can present data in many different ways. Depending on what you want to show, some ways of visualizing data will be more appropriate than the rest.
So what methods can be the most helpful? Start with the following types of visuals when creating your first infographic.
- Bar charts — this type of data visualization is comparably better than pie charts or bubble charts. With a bar chart, anyone can quickly understand the proportions between data points.
- Maps — use them if you need to show the distribution across a particular geographical area.
- Timelines — are the best tool to visualize time.
- Photos — sometimes, you can add this element to your infographics to show how a concept has changed over time.
- Venn diagrams — helps show topics overlap.
- Scatter Plots — show relations between two data sets.
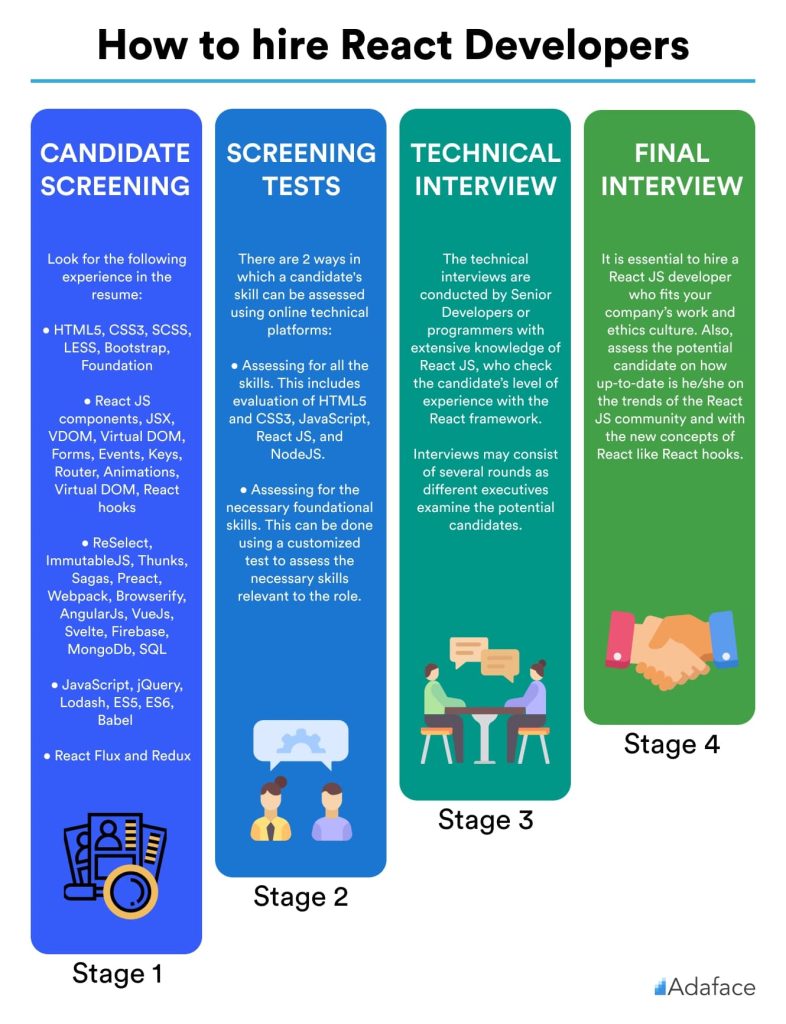
When designing an infographic, prioritize the idea and goal. Start by understanding what you want people to understand. For example, in the infographic below created by Adaface, you can see that the main goal was presenting a process broken down into stages.
2. Choose the right template
If you decide to create your infographic from scratch, get ready to spend hours choosing your visuals and organizing information within the right structure. But isn’t there a faster way to do it?
Sure — with infographics templates, you already have a big part of the job done for you by professional designers.
All you have to do is substitute the information, change images, or adjust colors. It shouldn’t take you much time if you already have an idea of what you want to communicate in the text.
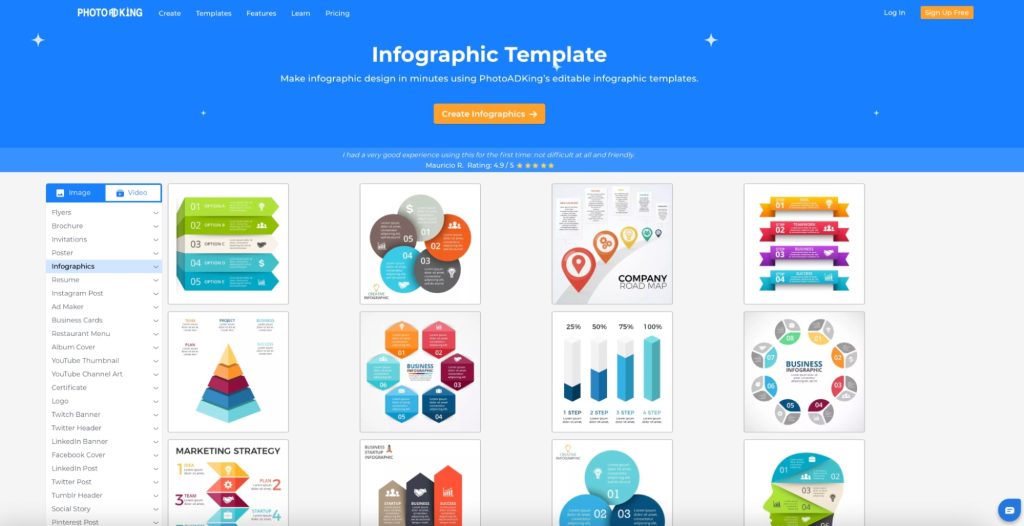
When choosing infographics services, you can quickly filter based on the topic of your infographic and visual type which makes the selection process much easier.
Apart from the aspect of saving time, browsing different infographics layouts helps you better understand the best way to organize information. In some cases, you can get a few good ideas that can inspire you.
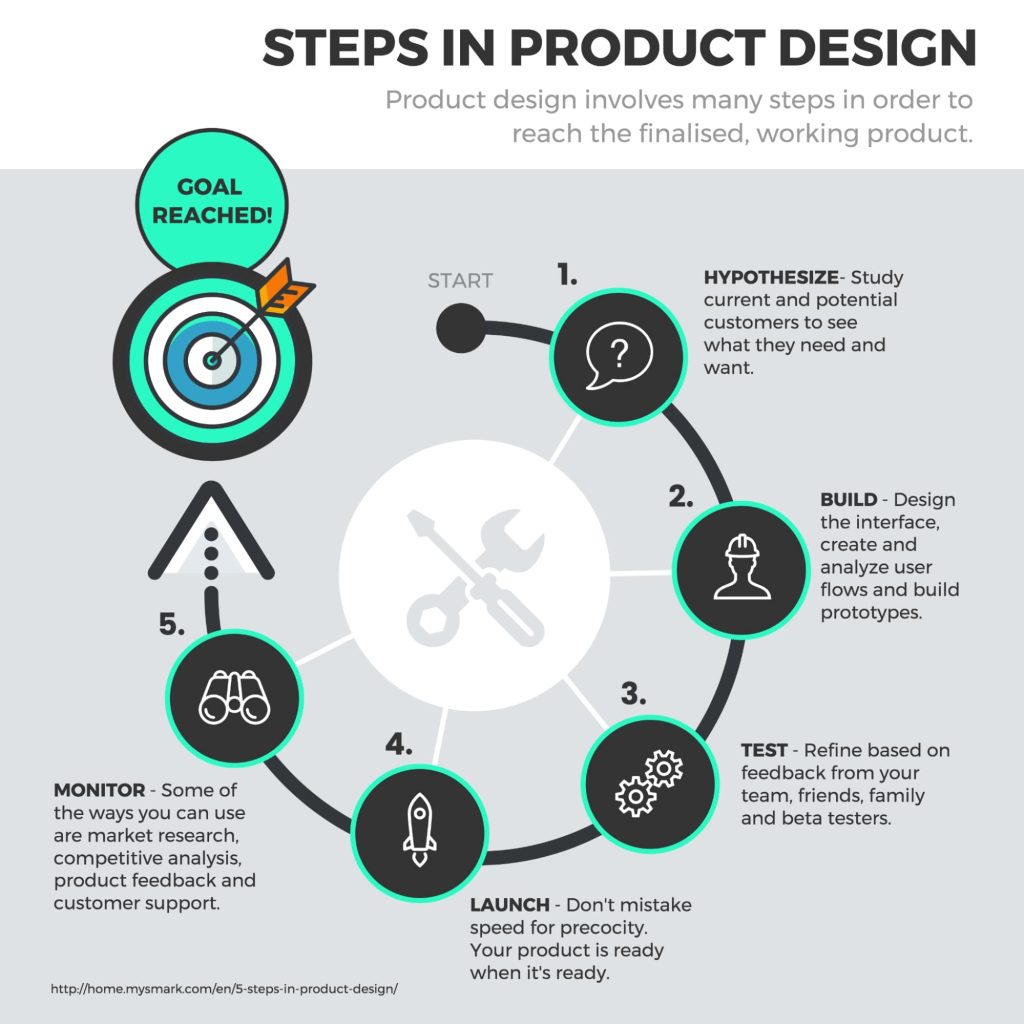
When you start designing an infographic, you have to choose a layout based on structure. For example, if you have to visualize some process, you should look for a layout that shows steps like the example below.
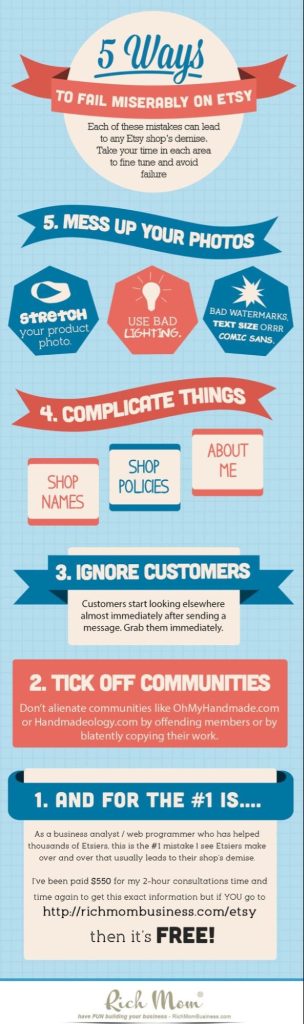
If you have to incorporate a lot of information, use a layout with multiple columns. Here is an example of an infographic with a humorous take on how to sell through a marketplace. Note how it uses ribbon banners to create multiple sections.
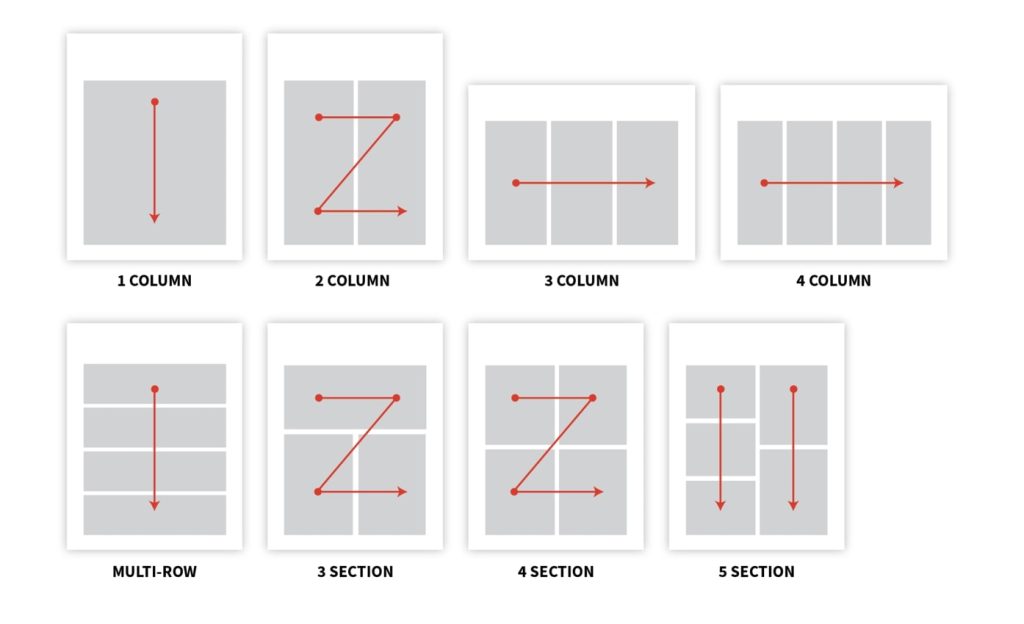
To give elements some order, use the grid layout. Here are some of its variations.
3. Think about your target audience
Imagine you have to prepare two infographics. One will be distributed among first-year primary school students.

And the other one would be sent to adults.

For both infographics, you would use different terminology, and visuals and they would differ from each other in terms of complexity of concepts.
That’s why it’s so important to first understand what learning needs both audiences have, how advanced their knowledge is about the presented concepts, and what visuals would appeal to them.
When preparing the content for infographics, jot down a few important aspects to keep in mind about your target persona before moving to choose a layout.
There are a few questions that you can answer in the beginning:
- Who is my target buyer? Who is my reader?
- What channels does my audience use and browse the most?
- What statistics about my target audience do I have on the table and what specifically can it tell me about who my target reader is?
4. Prepare a good headline
Your infographic headline is one of the elements that a reader will see before reading the details. It’s similar to newspaper headlines — if it’s intriguing, sparks interest, or poses an open question, a reader will proceed with reading the article.
So how can you create a headline that keeps a user reading your infographic from A to Z? Here are some aspects to keep in mind when writing down your headline versions.
- Make it short — 70 characters should be the upper limit of your headline’s word count. When scanning text, a user should quickly understand what the infographic is about.
- Account for the target audience — create titles that would resonate with your target audience. Start by understanding the interests, goals they perceive, and fears they have related to the covered subject.
- Add keywords — use the keywords people would use to search for an infographic. You can use various keyword research tools to understand search volume for popular keywords.
- Check your competitors — find out how your competitors name their content to get some ideas. It shouldn’t be an infographic — you can look into article titles related to your infographic topic.
5. Double-check your statistics
People with an eye for detail can quickly spot inconsistencies in data. What an awkward situation would it be if you received comments on social media saying your infographic contains mistakes!
To avoid such situations, make sure you follow some procedure for checking data before using it in your infographic. Here are some steps we are suggesting following.
- Check the author of the data source — find out if the publication was sponsored and if it includes any advertisement. Focus on using unbiased sources.
- Use fresh data — studies quickly get outdated especially in dynamically changing fields. Don’t use data that is more than three years old.
- Look for a source bibliography — the study should be backed with some extensive research and have its sources cited in the bibliography. You might also want to go through all links mentioned in the bibliography and check if they cover the topic of your main source.
6. Keep in mind best design practices
You don’t have to be an expert in Adobe Photoshop to create a professional infographic, but you have to know at least some basic design principles to create visually appealing graphics.
Here are some of the basic design principles that you have to keep in mind to make your infographics more engaging.
- Clear hierarchy — define what information should appear on the top of your infographic. Keep your structure logical — you are telling a story that has a beginning and end.
- Use consistent fonts and colors — don’t get carried away with too many fonts. Choose one or two fonts and use them consistently across the infographic. The same applies to colors — to keep your brand memorable, use those from your brand book.
- Use white space — white space can help keep your infographics easy to read and navigate. White space is space around content and infographic elements. It helps your design “breathe”.
- Use matching illustrations — use graphics that reinforce the message of your infographic and avoid using images just for the sake of breaking text with visual elements.
- Don’t overwhelm a reader — keep a reader’s focus on the key information and the message, not on the shiny things such as 3D animations, multiple graphs, charts, or colorful icons.
7. Optimize your infographics SEO
An infographic that is engaging is often frequently shared on social media and used in blog posts. That’s why infographics are often considered a classic growth hacking technique for an organic improvement of your domain rating score.
To make it easier for people to find and share your infographic, you have to remember a few crucial optimization steps. Here are the most important elements that need to be optimized:
- Headline — create a headline that catches the reader’s attention and include your keyword in it.
- Meta description — make your headline actionable and mention how the article can be useful for a reader. Make sure your main keyword is located in meta description content as well.
- Filename — don’t name your image files randomly — always incorporate your main keyword. This applies to all images used in a blog post.
- ALT tag — with this element, you can explain to search engines what your image contains, so they can index your infographic properly. Make sure you also include the keyword here.
- Headings — both main and secondary keywords should be found in your h1, h2, and h3 headings.
- URL — your article URL where your infographic is located should be short and contain your main keyword.
- Blog copy — feature your infographic in the right place — it should come as a summary of previously mentioned aspects you describe in the article.
- Add social sharing buttons and a CTA — remind your readers that they can share your content on Facebook, Twitter, and LinkedIn.
- Remember about blog word count — search engines favor content that is optimized and contains the right number of words. To learn what your word count should be, check how long the articles from the top search results are for a selected keyword.
- Ensure the right resolution — use full graphics resolution and make sure the image can be displayed on all screens.
- Add embed code — include the code that readers can copy from your website to embed your infographic on their website. You can place it right under your infographic.
Summary
You don’t need to be a professional designer to create engaging infographics that your readers enjoy and want to share on social media or embed in their blog articles. The message you want to convey and the form you choose for this task are often more important than the design itself.
Your design layout can only reinforce the message and make the infographic look more attractive and catchy. Knowing a few basic design principles will be sufficient to accomplish this goal.
With all templates available now for wider use, creating an infographic is simple as a piece of cake. Now, it’s time to define the idea for it.